fplot Manual
6 Advanced Features
This page covers some of the more advanced capabilities of fplot, such as creating composite plots, adding annotations, and using raw Gnuplot commands.
NOTE: Fennel Macros are not included in this wiki page, because they have their own dedicated section.
6.1 Multiplot
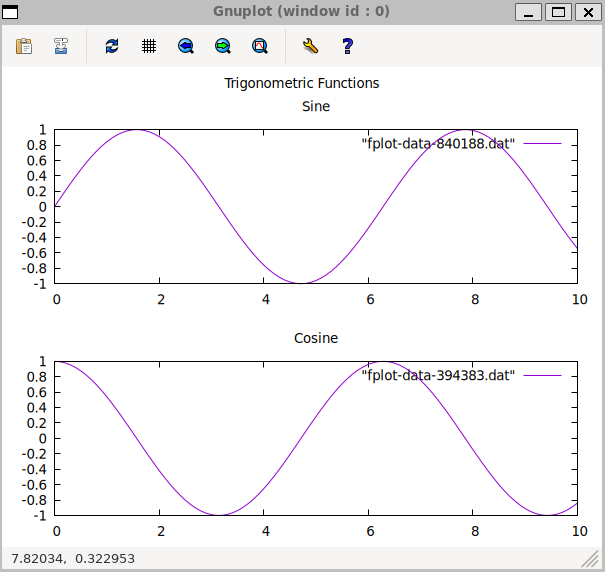
fplot makes it easy to combine several plots into a single image using Gnuplot’s multiplot feature. You enable this by passing multiple plot configuration tables to the fplot.plot function. The last table argument is special: it must contain the :multiplot configuration within its :options table.
The :multiplot table accepts the following keys:
:layout: A table [rows, cols] defining the grid for the subplots.
:title: An optional overall title for the entire multiplot figure.
Example: 2x1 Multiplot
This example creates two plots stacked vertically.
(local fplot (require :fplot))
;; --- Data ---
(local sin-data [])
(local cos-data [])
(for [i 0 100]
(let [x (* i 0.1)]
(table.insert sin-data [x (math.sin x)])
(table.insert cos-data [x (math.cos x)])))
;; --- Plotting ---
(fplot.plot
;; Plot 1: Sine
{:options {:title "Sine"}
        :datasets [{:data sin-data}]}
;; Plot 2: Cosine
{:options {:title "Cosine"}
        :datasets [{:data cos-data}]}
;; Multiplot Configuration (in the last table)
{:options {:multiplot {:layout [2 1]
                        :title "Trigonometric Functions"}}})
require("fennel").install()
local fplot = require("fplot")

-- --- Data ---
local sin_data = {}
local cos_data = {}
for i = 0, 100 do
local x = i * 0.1
table.insert(sin_data, {x, math.sin(x)})
table.insert(cos_data, {x, math.cos(x)})
end

-- --- Plotting ---
fplot.plot(
-- Plot 1: Sine
{
        options = { title = "Sine" },
        datasets = { { data = sin_data } }
},

-- Plot 2: Cosine
{
        options = { title = "Cosine" },
        datasets = { { data = cos_data } }
},

-- Multiplot Configuration (in the last table)
{
        options = {
                multiplot = {
                        layout = {2, 1},
                        title = "Trigonometric Functions"
                }
        }
}
)
6.2 Labels, Arrows, and Objects
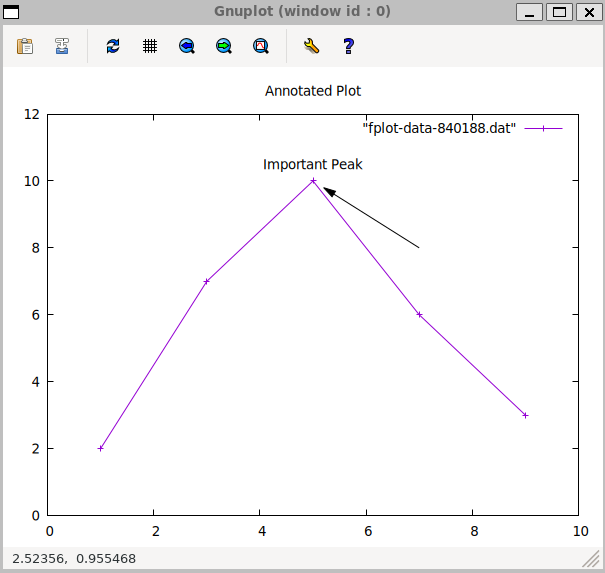
You can add arbitrary annotations to your plot using the :labels, :arrows, and :objects options.
-
• :labels: Add text to the plot. Each label is a table [text, x, y, options].
-
• :arrows: Draw arrows. Each arrow is a table [x1, y1, x2, y2, options].
-
• :objects: Draw shapes (rectangles, circles, etc.). Each object is a table [type, definition].
Example: Annotating a Peak
(fplot.plot
{:options {:title "Annotated Plot"
                :x-range [0 10]
                :y-range [0 12]
                :labels [["Important Peak" 5 10.5 "center"]]
                :arrows [[7 8 5.2 9.8 "head filled"]]
                :objects [["rectangle" "from 4,0 to 6,10 fs transparent solid 0.1 noborder"]]}
        :datasets [{:data [[1 2] [3 7] [5 10] [7 6] [9 3]]
                :style "linespoints"}]})
fplot.plot({
        options = {
                title = "Annotated Plot",
                ["x-range"] = {0, 10},
                ["y-range"] = {0, 12},
                labels = {
                        {"Important Peak", 5, 10.5, "center"}
                },
                arrows = {
                        {7, 8, 5.2, 9.8, "head filled"}
                },
                objects = {
                        {"rectangle", "from 4,0 to 6,10 fs transparent solid 0.1 noborder"}
                }
        },
        datasets = {
                {
                        data = {{1, 2}, {3, 7}, {5, 10}, {7, 6}, {9, 3}},
                        style = "linespoints"
                }
        }
})
6.3 Custom Tics
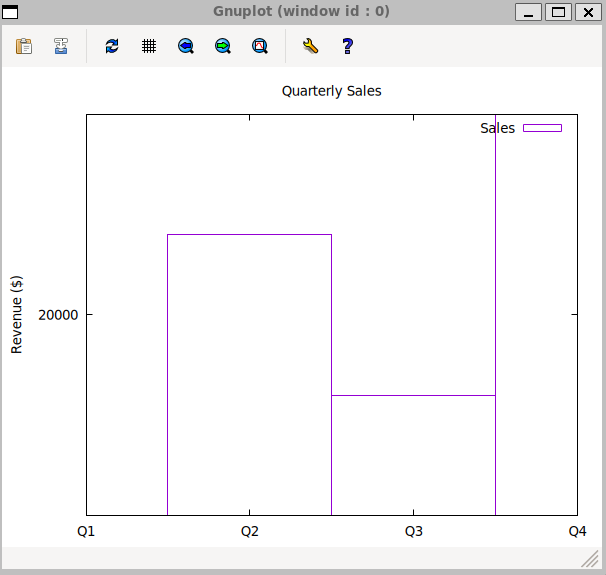
You can take full control over the axis tic marks using the :xtics and :ytics options. This is useful for categorical data or for highlighting specific points. Provide a list of ["label", value] pairs.
Example: Labeled Tics
(local fplot (require :fplot))

(fplot.plot
{:options {:title "Quarterly Sales"
                :xtics [["Q1" 1] ["Q2" 2] ["Q3" 3] ["Q4" 4]]
                :ytics [0 10000 20000 30000]
                :y-label "Revenue (\$)"}
        :datasets [{:data [[1 15000] [2 22000] [3 18000] [4 25000]]
                :style "boxes"
                :title "Sales"}]})
require("fennel").install()
local fplot = require("fplot")

fplot.plot({
        options = {
                title = "Quarterly Sales",
                xtics = {{"Q1", 1}, {"Q2", 2}, {"Q3", 3}, {"Q4", 4}},
                ytics = {0, 10000, 20000, 30000},
                ["y-label"] = "Revenue (\$)"
        },
        datasets = {
                {
                        data = {{1, 15000}, {2, 22000}, {3, 18000}, {4, 25000}},
                        style = "boxes",
                        title = "Sales"
                }
        }
})
6.4 Extra Options (:extra-opts)
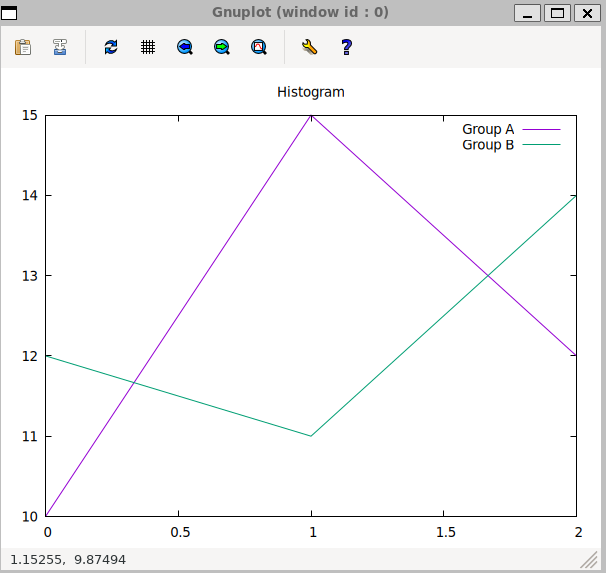
For features that are not directly exposed by fplot, you can use the :extra-opts option to pass raw command strings directly to the Gnuplot script. This provides an escape hatch for accessing the full power of Gnuplot.
Example: Setting a Custom Fill Style
(local fplot (require :fplot))

(fplot.plot
{:options {:title "Histogram"
                :extra-opts ["set style fill solid 0.6 border -1"
                "set style histogram clustered gap 2"
                "set style data histograms"]}
        :datasets [{:title "Group A" :data [10 15 12]}
        {:title "Group B" :data [12 11 14]}]})
require("fennel").install()
local fplot = require("fplot")

fplot.plot({
        options = {
                title = "Histogram",
                ["extra-opts"] = {
                        "set style fill solid 0.6 border -1",
                        "set style histogram clustered gap 2",
                        "set style data histograms"
                }
        },
        datasets = {
                { title = "Group A", data = {10, 15, 12} },
                { title = "Group B", data = {12, 11, 14} }
        }
})