fplot Manual
8 Examples
This page provides a gallery of examples to showcase the kinds of plots you can create with fplot. Each example includes the code in both Fennel and Lua, along with the resulting plot.
8.1 1. Line and Point Plot
A standard plot combining smooth lines and distinct data points.
Fennel
(local fplot (require :fplot))

(local data1 [])
(for [i 0 50]
(let [x (* i 0.2)]
(table.insert data1 [x (* (math.exp (* -0.1 x)) (math.cos x))])))

(local data2 [[1 0.5] [3 0.1] [5 -0.2] [7 -0.1] [9 0.05]])

(fplot.plot
{:options {:title "Damped Oscillation with Data Points"
                :x-label "Time"
                :y-label "Amplitude"
                :grid true
                :key {:position "top right"}}
        :datasets [{:title "Model"
                :style "lines"
                :color "blue"
                :data data1}
        {:title "Measurements"
                :style "points"
                :color "red"
                :pointtype 7
                :data data2}]})
Lua
require("fennel").install()
local fplot = require("fplot")

local data1 = {}
for i = 0, 50 do
local x = i * 0.2
table.insert(data1, {x, math.exp(-0.1 * x) * math.cos(x)})
end

local data2 = {{1, 0.5}, {3, 0.1}, {5, -0.2}, {7, -0.1}, {9, 0.05}}

fplot.plot({
        options = {
                title = "Damped Oscillation with Data Points",
                x_label = "Time",
                y_label = "Amplitude",
                grid = true,
                key = {position = "top right"}
        },
        datasets = {
                {
                        title = "Model",
                        style = "lines",
                        color = "blue",
                        data = data1
                },
                {
                        title = "Measurements",
                        style = "points",
                        color = "red",
                        pointtype = 7,
                        data = data2
                }
        }
})
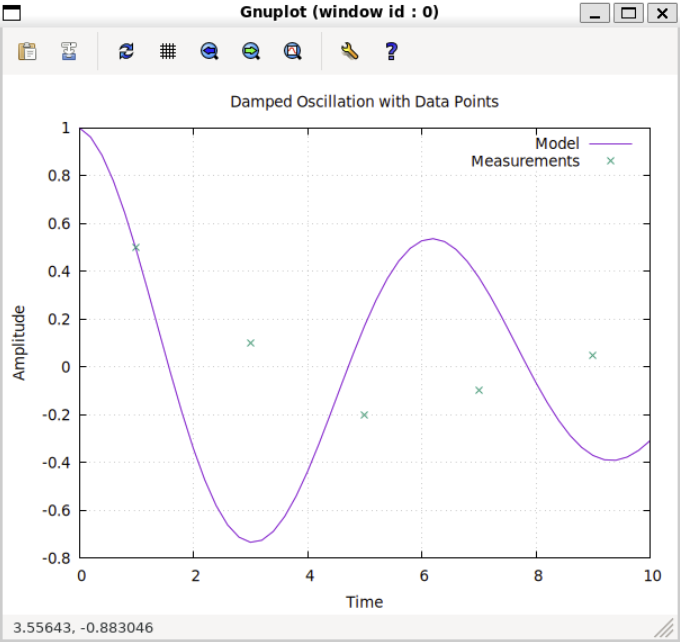
Figure 5: The resulting plot generated by fplot
8.2 2. Bar Chart / Histogram
Creating a bar chart using the boxes style, which is great for categorical data.
Fennel
(local fplot (require :fplot))

(fplot.plot
{:options {:title "Annual Production by Factory"
                :y-label "Units Produced"
                :x-range [0.5 4.5]
                :y-range [0 50000]
                :xtics [["North" 1] ["South" 2] ["East" 3] ["West" 4]]
                :extra-opts ["set style fill solid 0.8"]}
        :datasets [{:title "Production"
                :style "boxes"
                :data [[1 42000] [2 35000] [3 48000] [4 29000]]}]})
Lua
require("fennel").install()
local fplot = require("fplot")

fplot.plot({
        options = {
                title = "Annual Production by Factory",
                y_label = "Units Produced",
                x_range = {0.5, 4.5},
                y_range = {0, 50000},
                xtics = {{"North", 1}, {"South", 2}, {"East", 3}, {"West", 4}},
                extra_opts = {"set style fill solid 0.8"}
        },
        datasets = {
                {
                        title = "Production",
                        style = "boxes",
                        data = {{1, 42000}, {2, 35000}, {3, 48000}, {4, 29000}}
                }
        }
})
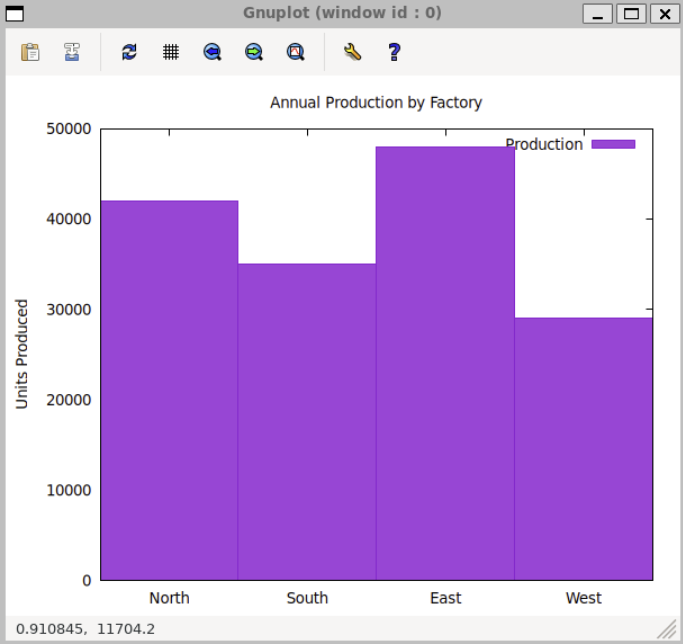
Figure 6: The resulting plot generated by fplot
8.3 3. 3D Surface Plot
Using fplot.splot to visualize three-dimensional data.
Fennel
(local fplot (require :fplot))

(local data [])
(for [i -20 20]
(let [x (* i 0.5)
row []]
(for [j -20 20]
(let [y (* j 0.5)
r (+ (math.sqrt (+ (* x x) (* y y))) 1e-6)
z (/ (math.sin r) r)]
(table.insert row [x y z])))
(table.insert data row)))

(fplot.splot
{:options {:title "Sinc Function"
                :z-label "z"
                :palette "viridis"}
        :datasets [{:data data
                :style "pm3d"
                :title ""}]})
Lua
require("fennel").install()
local fplot = require("fplot")

local data = {}
for i = -20, 20 do
local x = i * 0.5
local row = {}
for j = -20, 20 do
local y = j * 0.5
local r = math.sqrt(x*x + y*y) + 1e-6
local z = math.sin(r) / r
table.insert(row, {x, y, z})
end
table.insert(data, row)
end

fplot.splot({
        options = {
                title = "Sinc Function",
                z_label = "z",
                palette = "viridis"
        },
        datasets = {
                {
                        data = data,
                        style = "pm3d",
                        title = ""
                }
        }
})
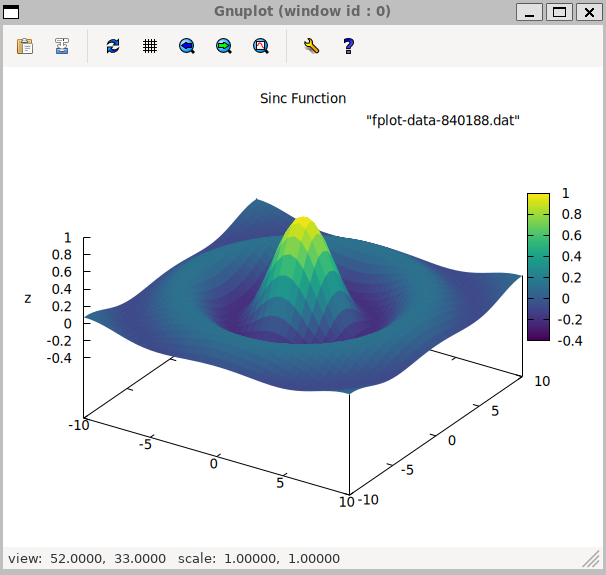
Figure 7: The resulting plot generated by fplot
8.4 4. Logarithmic Scale Plot
Useful for visualizing data that spans several orders of magnitude.
Fennel
(local fplot (require :fplot))

(local data [])
(for [x 1 100]
(table.insert data [x (* 1000 (math.exp (* -0.1 x)))]))

(fplot.plot
{:options {:title "Exponential Decay"
                :x-label "Time"
                :y-label "Value"
                :log-scale "y"
                :grid true}
        :datasets [{:title "Decay"
                :style "lines"
                :data data}]})
Lua
require("fennel").install()
local fplot = require("fplot")

local data = {}
for x = 1, 100 do
table.insert(data, {x, 1000 * math.exp(-0.1 * x)})
end

fplot.plot({
        options = {
                title = "Exponential Decay",
                x_label = "Time",
                y_label = "Value",
                log_scale = "y",
                grid = true
        },
        datasets = {
                {
                        title = "Decay",
                        style = "lines",
                        data = data
                }
        }
})
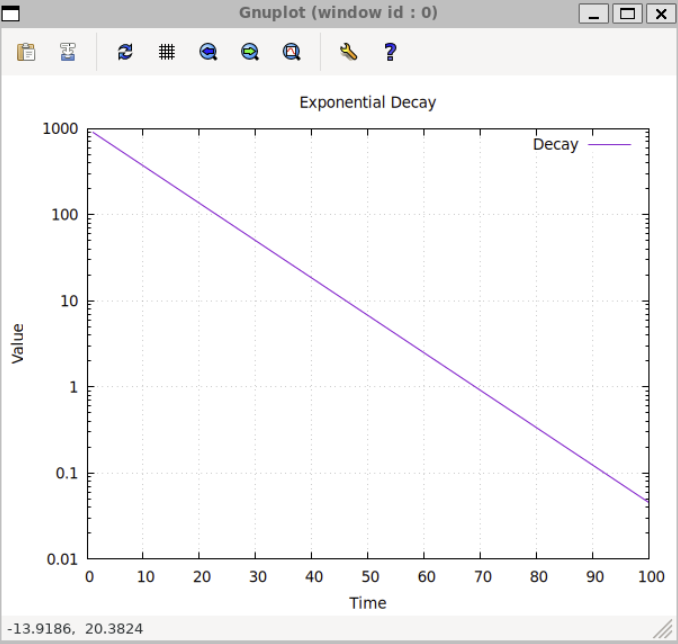
Figure 8: The resulting plot generated by fplot